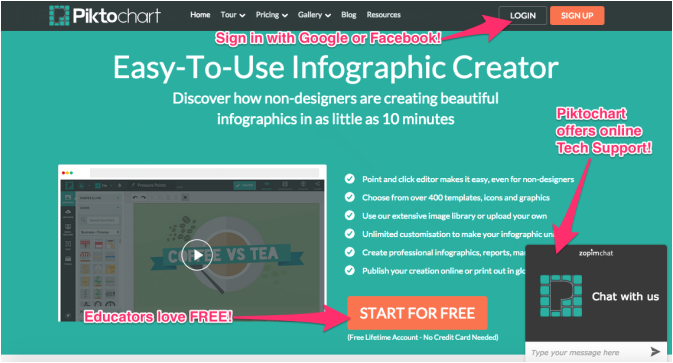
If a picture is worth a thousand words, then it is hard to imagine the amount of words an infographic is worth. In a society where patience is almost non-existent when it comes to finding the answer to a question, infographics are replacing traditional methods of presenting knowledge and content. As a teacher, I have become more aware that infographics are not only a great way to present students with content but can also be used to assess standards. Piktochart is a simple info-graphic creator that is web-based and is free to start out. Piktochart has infographics that have been featured on websites such as Forbes and Tech Crunch (APA format). The software is perfect for 21st century citizens, such as my 5th grade magnet students, to learn and use. I am confident that using Piktochart for project based learning and summative assessments in my classroom could help my students achieve learning objectives more easily.
Educational Value
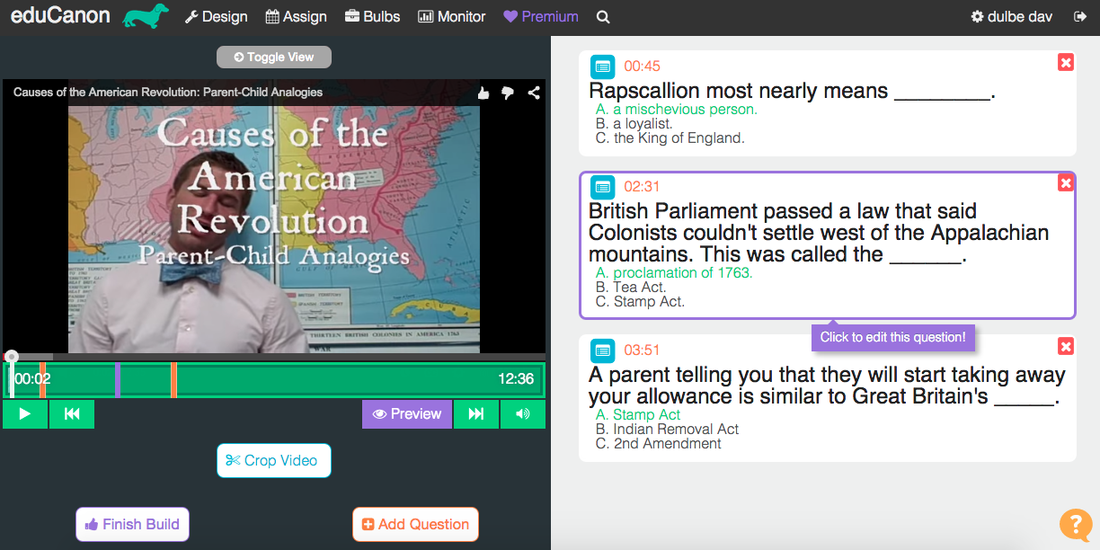
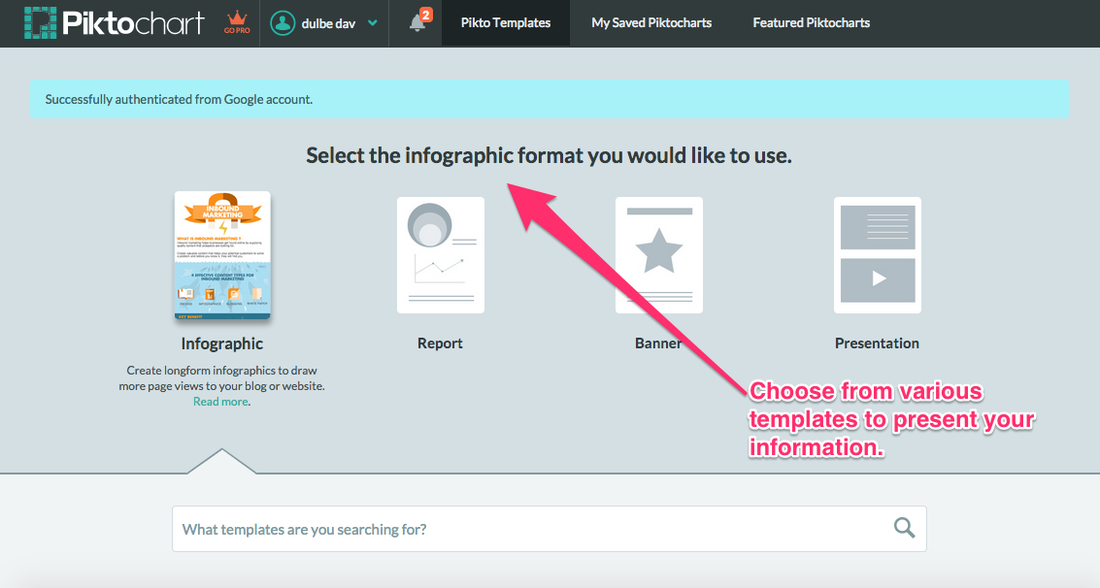
As I explored the potential values of using Piktochart in my classroom I have had several content-based projects and assessments in mind. For example, the students in my class have been studying revolutions and changes that occurred in history in our world. We have been focusing specifically on major events in U.S. history that caused the American Revolution. The students actually just made infographics that summarized two major events that led to the start of the Revolutionary War. Most of the students chose to closely study the Boston Tea Party and the Boston Massacre and made some great infographics as an assessment. Unfortunately, I had not heard of the Piktochart tool when assigning this project. Reflecting on the student’s finalproducts, Piktochart would have served as the perfect software for this project. Students could also use Piktochart to create infographics to display a math project, or present one of Newton’s Laws of Motion. My students also closely study various environmental biomes around the world and could create an infographic as the final product for this research. Lastly, students could use infographics to create an advertisement for a novel they recently read to assess comprehension.
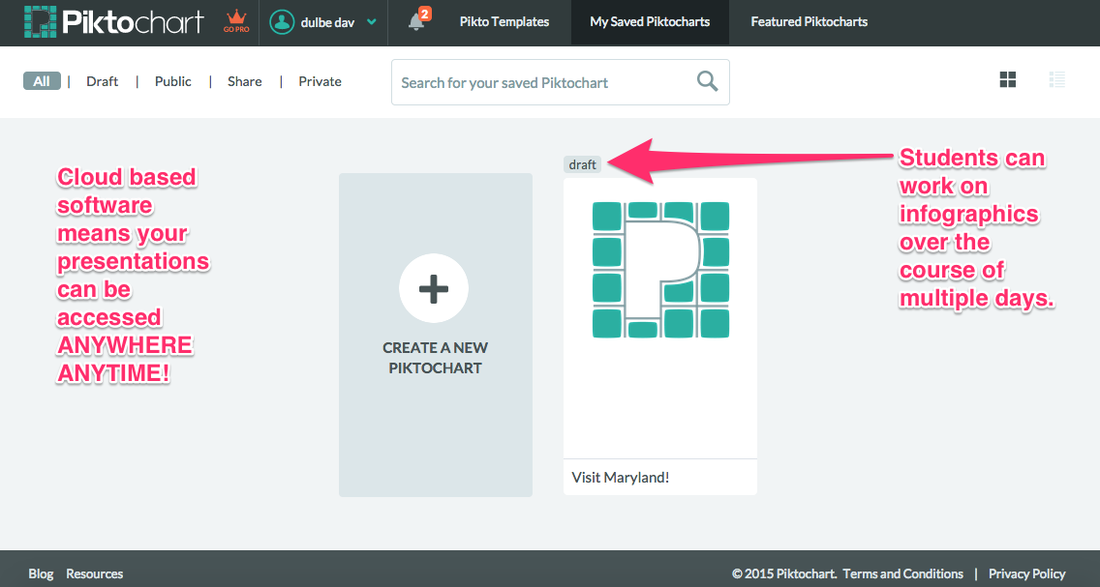
After testing out Piktochart myself and creating my own infographic, I think students as young as 3rd and 4th grade could handle the software. To fully understand the functionality of the software, I created an infographic advertisement to persuade travelers to visit Maryland. The real-time saving and easy-to-navigate tool box is something that elementary school students need. On the other end of the spectrum, the free version of Piktochart includes a variety of features that are appropriate for older students and adults. In fact, after reviewing the entire website, the software seems to target an audience of business professionals in addition to educators. In other words, the software is complex and rigorous when the user makes it so, but can also be simple and concise for beginners.
There are many benefits of using infographics in education to assess and teach academic standards. By performing close reading protocols and closely analyzing infographics with students in a whole or small group setting students learn to read more than just text. Infographics can provide students with an opportunity to closely examine images, graphs, maps and much more. One way that teachers could use Piktochart to enhance instruction is through creating infographics in presentation mode. Instead of using Powerpoint slides or Prezi, teachers can create infographics on Piktochart that teaches the necessary content. The infographic can be projected for the class to view in presentation as a whole group or on their own device. This mode allows viewers to enjoy all pieces of the infographic in a sequential format. Teachers can share the URL link to their Piktochart infographic for students to have access to at home. Students can then refer to this content-enriched infographic in whichever format they choose.
The main benefit of using this software over other instructional strategies is the various levels of thinking it requires students to conduct. As students use Piktochart to create their own infographics for projects and assessments, they navigate their way through multiple levels of Bloom’s Taxonomy. For example, if students were to create an infographic on the destruction of the Amazon Rainforest, they must first understand the content. They have to then apply research skills to answer focus questions that relate to the criteria their teacher desires. Simultaneously, students should be evaluating the research sources (i.e. primary vs. secondary, websites, journals etc…) as they answer their questions. They also need to evaluate and decide which non-copyrighted images and maps they might use in their infographic. Finally, students have to actually use the Piktochart software to create their infographic. I can confidently say that not many instructional strategies use this many different levels of thinking. In conclusion, Piktochart can certainly deliver and assess the objectives in a unique and efficient way that other software and instructional strategies cannot compete with.
As I think about the Common Core State Standards that 5th grade students need to master, I can think of several specific examples of how Piktochart can support this teaching and learning. The Piktochart website includes a featured section where students and teachers can view infographics that other users have created. As I think about the potential biome project, where students create a Piktochart on an environment like the Amazon Rainforest or Sahara Desert, this feature would be very helpful. Teachers could use featured infographics to point out examples and non-examples of what the students should do with their own Piktochart. I began working on my own infographic called “Visit Maryland!” so I could get a better sense of the tools that are available. One major benefit of this infographic software as opposed to others is the fact that you can upload your own images into your creations. As attendees of an arts and technology integrated school, my students do a lot of digital art projects on applications like Paper53, Drawcast, and Pixie. My 5th grade students also enjoy using PicSitch do make digital collages of their artwork. They would be able to create artwork that touches on the theme of their biome, such as a picture of trees being destroyed in a rainforest, and upload the original image into Piktochart. This practice would also teach students the idea that the best way to avoid copyright issues is to create your own music and images. As a final point, Piktochart has many strengths that would allow teachers to enrich a plethora of standards from the Common Core Curriculum.
Through creating my own infographic on Piktochart I found a minimal amount of limitations with the software. The main weakness of the software is the iOS application version for iPads. The application only allows users to share and view inforgraphics as opposed to create and make edits. This is quite common for web-based software and really does not surprise me. Unfortunately, my students use iPads on a daily basis and have limited access to laptops. On the other hand, students can view the featured secition of Piktochart on the iPad app. Therefore, my students would still be able to analyze and critique other user’s inforgraphics. One suggestion I would have for developers at Piktochart would involve the publishing stage. Conveniently, the software updates and saves automatically in real time as users work on their infographics. The Piktocharts will not update if any changes are made after they are published, however. As a teacher, my students complete all of their writing assignments on Evernote or Google Drive. They often publish sharable links to these documents on their My Big Campus blog for other students and teachers to see. Often times, I give the students feedback and ask that they make changes to their writing assignment. Even after the document is published to their blog, the Evernote or Google Drive links update in a matter of seconds. This is definitely a feature that Piktochart should consider adopting.
Student Engagement
Roblyer and Doering discuss the idea of information visualization in Integrating Educational Technology into Teaching. This concept is defined as the “use of pictures, symbols, colors, and words to communicate ideas, illustrate information, or express relationships visually” (Roblyer, Doering, 2013, p. 338). Infographics are a prime example of engaging students through information visualization techniques. Students as young as six or seven and as old as seventeen or eighteen are automatically drawn to an infographic when given the choice between a black and white article and a PDF created on Piktochart. The bright and vibrant colors, trendy backgrounds and images, and short and concise amounts of text are often much more appealing. I would argue that students would also be much more engaged in creating an infographic as an assessment rather than writing a traditional essay. In my opinion, both assignments can assess content standards holistically and formatively. Using Piktochart for the assessment choice gives students freedom to express their creativity and go above and beyond the curriculum.
Another feature of Piktochart that is appealing to the educators and students is the concept of publishing. I have found that my students are inclined to work harder on projects that will be showcased to an audience greater than their parents and me. By simply clicking the publish button, my students know that their work can, and often will be, viewed with more than just our classroom community. The concept of having a 5th grade student publish an infographic to the web may sound outrageous to most people, but my students, and many others around the world are more than capable. Piktochart is software that is used by global citizens who hold careers in various fields. Reading and creating infographics is a true 21st century skill that will soon become a necessary form of literacy. Students who engage in projects with Piktochart are sure to be ahead of the game.
Ease of Use/ Installation
The primary version of Piktochart is a web-based software and therefore does not require any downloading. The iOS application downloads very quickly and only takes up 13.8 MB. The tutorial video on the Piktochart website provides easy tips for navigation that allowed me to understand the software in a few minutes. I feel that students would also find Piktochart very easy to learn and use. The infographic creator tools are all clearly listed on the left column of any browser and students can obviously see that they need to be clicked and dragged onto the template. The share, download, publish, and preview features are not only labeled in text but with the universal symbols as well. Most importantly, I found that Piktochart was quick and used minimal bandwidth from my home and school Wi-Fi connections. This provided me with a smooth and efficient experience while testing the software firsthand. Overall, Piktochart is extremely user friendly for teachers and students both. It is no wonder that the website’s testimonials page is filled with quotes from happy users from all over the world.
Compare and Contrast
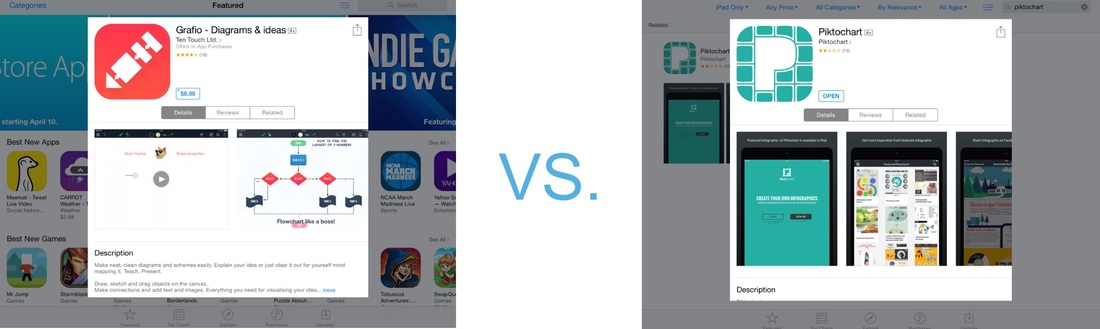
An infographic creator for iPads is Grafio. This software has a free and paid ($8.99) version. After reviewing the free version of Grafio on my iPad I am still confident that Piktochart is much better software for creating infographics. Although Grafio does work on an iPad and does nit require a Wi-Fi, the application lacks many of the user-friendly features that Piktochart includes. For example, when adding and moving content on the infographic template on Piktochart, small crosshairs appear to keep the content centered and at 90 degree angles. This feature allows users to create an infographic that is aligned vertically and horizontally in a neat and organized fashion. This feature may seem simple unimportant, but for students who are just starting out with infographic creation projects, it is more than necessary. Grafio lacks this alignment feature, making it less user friendly for upper-elementary age users. The Grafio app also does not allow users to publish their finished infographics with an HTML embed code like Piktochart does. This feature is necessary for my students to blog about their projects and link them to a QR code. Reviewing the Grafio application has convinced me to believe that Piktochart is a perfect combination of simplicity and creativity. I am more than willing to schedule time in the school computer lab to use this web-based software rather than an iPad application that lacks the functionality my students need.
An infographic creator for iPads is Grafio. This software has a free and paid ($8.99) version. After reviewing the free version of Grafio on my iPad I am still confident that Piktochart is much better software for creating infographics. Although Grafio does work on an iPad and does nit require a Wi-Fi, the application lacks many of the user-friendly features that Piktochart includes. For example, when adding and moving content on the infographic template on Piktochart, small crosshairs appear to keep the content centered and at 90 degree angles. This feature allows users to create an infographic that is aligned vertically and horizontally in a neat and organized fashion. This feature may seem simple unimportant, but for students who are just starting out with infographic creation projects, it is more than necessary. Grafio lacks this alignment feature, making it less user friendly for upper-elementary age users. The Grafio app also does not allow users to publish their finished infographics with an HTML embed code like Piktochart does. This feature is necessary for my students to blog about their projects and link them to a QR code. Reviewing the Grafio application has convinced me to believe that Piktochart is a perfect combination of simplicity and creativity. I am more than willing to schedule time in the school computer lab to use this web-based software rather than an iPad application that lacks the functionality my students need.
Recommendation
I would definitely recommend that fellow 5th grade teachers try using Piktochart with their students. I would rate the web-based version of this software a 4.5 out of 5 and the iPad application a 3.5 out of 5. The strengths of this software outweigh the short list of limitations by a long shot. The user guides on the homepage of Piktochart.com engage beginner users right away and meet the needs of various learning styles. Whether teachers are planning to create infographics for their students or with their students, Piktochart would be my software of choice. Other infographic creators like Infogr.am or Grafio are not nearly as versatile and user friendly in my opinion. After reviewing the software I am excited to finish and publish my “Visit Maryland!” infographic and share it with my students. Even more, I am ecstatic to get started with a project that assesses the mastery of a content standard by having students create infographics on Piktocharts. During the last marking period I plan to have students create infographics about the United States government. I will publish each of the student’s infographics to my Twitter account so stay tuned!
Sources
Create Easy Infographics, Reports, Presentations | Piktochart. (2014, May 9). Retrieved March 18, 2015, from http://piktochart.com/
Roblyer, M., & Doering, A. (2013). Theory into Practice: Foundations for Effective Technology Integration. In Integrating Educational Technology into Teaching (6th ed., p. 338). Boston, Massachusetts: Pearson Education.