Mr. Dulberger's 5th Grade University
Contact Mr. Dulberger
  • Home Base
    • Monthly Newsletters
    • Mr. Dulberger's Blog Page
    • Photo Albums
  • STREAM
    • Science
    • Technology
    • Research
    • Engineering
    • Arts
    • Mathematics >
      • Math Problems of the Week
  • Resources (For Students, Parents and/or Teachers)
    • 5th Grade Legacy Project
    • Collaborative Learning
    • Digital Lessons
    • Favorite Monthly Resources
    • Khan Academy and Learnzillion
    • MAPs
    • PARCC
  • Read, Write and Relax!
    • Mr. Dulberger's Writing Portfolio

Mr. Dulberger's Digital Digest
A Blog for the Progressive Educator

In a world where a textbooks are prehistoric and Elementary students are writing HTML codes to design their own video games, educators must keep up! Students know better than to show up to class with a pencil and notepad ready to record a lecture. Green screen recording, podcasting and real-time collaborative documents have all replaced the multiple choice assessment. Educators who are willing to take risks will help pave the way for the world's brightest problem solvers. Use this blog to help you keep pace with your tech-savvy students and use digital learning to create a risk-taking classroom environment.

Google +

EDTC 615 Final Blog Post

4/24/2016

0 Comments

 
Disclaimer: This post is for a graduate school (University of Maryland University College) assignment.

The Data Meeting Process Overall

     Throughout the Spring 2016 semester I have had the opportunity to work in a Professional Learning Community (PLC) of three dedicated educators. Our data team was made up of the following:
  • Steven Garrison - 4th grade, Prince George’s County Public Schools
  • Katelynn Ruby-Leftridge - 7th grade, Harford County Public Schools
  • LaShawn Brown - Middle School Program Coordinator, Baltimore County Public Schools
  • David Dulberger (myself) - 5th grade, Washington County Public Schools

     As one can see, this data team not only comes from different counties in Maryland, but different regions within the state as well. On the team we had two teachers from the elementary level and two from the middle school level. I strongly believe that this level of diversity within the group allowed for successful ideas and conversation.
     From our very first meeting I could tell that communication would be an essential ingredient for these successes. Being that EDTC 615 is solely an online course, most of us were under the impression that we could complete the work at times that were convenient for us. We soon realized that this would not always be the case.
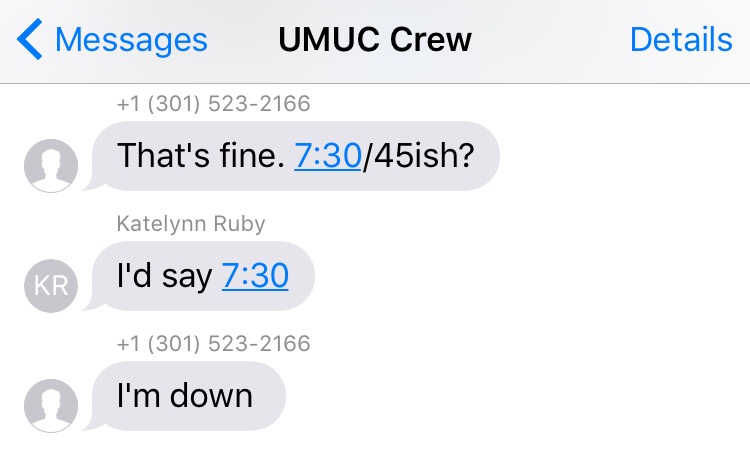
     Rather that using the UMUC site and email as our primary communication tool, our informal conversations, plans for meeting times, and questions were soon moved to a group iMessage/ text message thread. As seen in the image below, this allowed for more consistent and timely feedback. Thanks to this tool we were able to discuss meeting dates and times more easily.
Picture


​The Target Students

     Throughout the entire data meeting process, Steven kept us posted on his students. Just as the initial data described, Steven has a wide range of reading abilities and disabilities within his student population. This seems to be apparent in many urban elementary schools, especially those in urban settings. I was excited about the student data and exploratory question we chose as a group to focus on because I had found similar patterns with my students reading data this year. Specifically these patterns indicated a decrease in certain student's’ lexile scores from Fall to Winter testing. As the semester moved on we were able to brainstorm a comprehensive list of strategies, tools, and evaluation metrics that would ultimately help close this learning gap.
     Being a part of a data team with a structured focus and agenda has also been beneficial to me as a learner and teacher as well as Steven’s students. For instance, the course often required us to present the knowledge and experience we gained from data meetings through a collaborative screencast. Due to the nature of these assignments, my group always found it beneficial to write a script and practice. This process forced my group and I to closely share the instructional resources like Front Row, MyOn, Achieve 3000, and Reading A-Z with each other. Explicitly demonstrating these instructional tools for each other was necessary before going on “camera.” I truly feel that the rehearsals and demonstrations have impacted the students. This impact may not have been direct but it certainly has been positive.

*These tools were outlined in my final project screen cast I completed a week ago. ​


Our Goal

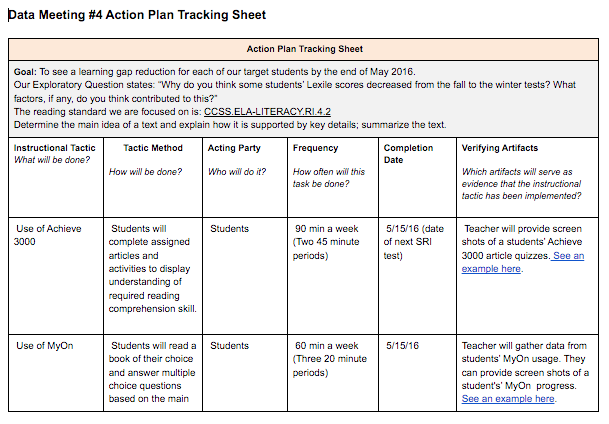
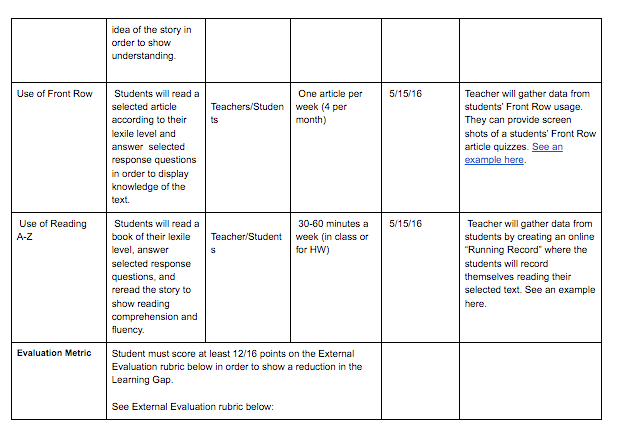
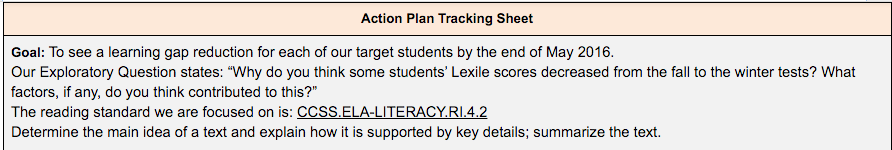
     As described on our 4th Data Meeting Action Plan Tracking Sheet below, our goal is for the target group of students to receive 12 or more points on our External Evaluation rubric. Since Steven has not had much time to implement the tactic methods our group established during this data meeting, I look forward to hearing from him in a month or so about the hopeful progress his students made. ​
Picture


​Future PLCs and Data Teams

     I am certain that the experiences I have gained from my EDTC 615 data meetings will help me as an educator and leader in my own school. As I move into my 5th year of teaching next year I will have more and more opportunities to share my expertise with colleagues from my school and county. As we use models like SAMR and TPCK to guide instructional planning, I will also share my experiences with Venables Turning Data into Action model. ​


​Sources

Venables,D.R.(2014). How teachers can turn data into action. Alexandria, VA. ASCD.
0 Comments

Data Meeting #5 (UMUC 615 Course)

4/12/2016

0 Comments

 
Disclaimer: This post is for a graduate school (University of Maryland University College) assignment.
Picture

The Final Meeting

     Data meeting #5 served as the final meeting for Kate, Steven, LaShawn, and I. One complaint we had about this particular meeting was the timing. During the fourth data meeting we established each completion data for our instructional tactics to be May 15, 2016. Hosting this final data meeting only a few days after finalizing our Data Action Plan (DAP) made an evaluation of the plan somewhat difficult. Despite this conflict in timing, our group made the most of hour long meeting on Sunday, April 10, 2016.

     Venables breaks the final data meeting down into various steps. The first step involves an evaluation process where team members discuss how effective the their DAP implementation was. Since Steven did not get much time to fully implement the DAP with his students, we focused on the little information that we had. Steven did share concerns for the instructional tactic Reading A-Z. As seen in the image below, his students were not thriving with this instructional tool in a whole group setting. Due to this, we recognized that changes to the DAP would be needed.
group_4_sri_sample_.pdf
File Size: 101 kb
File Type: pdf
Download File

Adjusting Instruction

     The discussion that took place during our data meeting was all about the adjustments we could make to our DAP. Specifically we each brainstormed ways that the current instructional tactics could be used differently to support the students better. Steven mentioned how the Reading A-Z program would probably be more effective if used in a small group or even individual student setting. These changes were noted on our Data Meeting #5 Google Doc.

    We also discussed how students did seem to be succeeding on the Achieve 3000 program. This indicated that no major change to the use of this instructional tactic was needed.

Tying IT All Together

     As we closed the 5th and final data meeting we discussed the benefits of collaborating with such passionate and forward-thinking educators. Over the past ten weeks, Steven, LaShawn, Kate, and I have very grown comfortable with making collaborative decisions and plans that will impact real students. We have used technology to it’s fullest degree to build a professional learning community that is effective and personalized. In fact, I recently had the opportunity to have lunch with Dr. Ruben Puentedura when he visited my school for an Apple research meeting. Dr. Puentedura founded the SAMR model that evaluates a teacher's’ use of technology in the classroom. As graduate students at UMUC, I would argue that our use of technology to collaborate, plan, and communicate have often reached levels of modification and even redefinition on the SAMR ladder. I look forward to using this experience to help my school’s PLC grow.
Picture
Dr. Ruben Puentedura and I (SAMR - Substitution, Augmentation, Modification, Redefinition)

Sources

Venables,D.R.(2014). How teachers can turn data into action. Alexandria, VA. ASCD.  ​
0 Comments

Data Meeting #4 (UMUC EDTC 615 Course)

4/3/2016

0 Comments

 
Disclaimer: This post is for a graduate school (University of Maryland University College) assignment.

Purpose of Data Meeting #4

     The purpose of the fourth data meeting was to devise an official Data Action Plan (DAP). Specifically Venables defines this strategy to be targeted more towards the teachers. In his words he writes, “whereas a Target Learning Goal focuses the team on the behavior and performance of students, the Data Action Plan focuses the team on the behavior and performances of teachers, particularly during instruction.” In other words, the purpose of this meeting was for us to decide what action needed to be taken by Steven in the classroom to help his students achieve their SMART goals during data meeting #3.

     Venables offers a helpful graphic organizers for educators to use during this fourth data meeting called the Action Plan Tracking Sheet (pictured below). Despite the fact that none of us have observed each other actually teach first hand, we are all pretty familiar with each other’s methods and teaching strategies by this point. We are also very familiar with the data that Steven originally presented to us during the first data meeting several weeks ago. All of these factors made for a smooth and seamless collaborative meeting on Thursday, March 31, 2016.
Picture
Picture

Online Collaboration

     Steven, Kate, LaShawn, and I chose to use Google Hangouts again to collaborate. Prior to connecting online, we each added some artifacts that we thought would be helpful into our Week 9 shared folder on Google Drive. This folder continued to grow during the meeting as shown in the image below.
Picture
     Just as Venables recommends, each team member brought a different idea to the table as we brainstormed various instructional tactics. Throughout the brainstorm we were able to delve into deeper discussion about educational technology tools like Achieve 3000, MyOn, and Front Row. The screen share feature on Google Hangouts allowed us to take a closer look at these tools. We easily agreed that the four instructional tactics we would use would be:
  • Achieve 3000
  • MyOn
  • Front Row
  • Reading A-Z

    Through using these tools effectively at various frequencies we are confident that we will see a Learning Gap reduction in the target group of students by the end of May. ​

Evaluating Progress and Growth

     One of the key components to the DAP and specifically the Action Plan Tracking Sheet is establishing an evaluation metric. This component allows teachers to measure whether or not their students are showing a reduction in the desired learning gap. Check out this screencast below to see how our evaluation metric works. (Start at 6:30)


​Concluding the Meeting

     Overall, data meeting #4 was another huge success. The Google Apps for Education (GAFE) have enabled us to effectively collaborate, create multimedia presentations, and make informed decisions to plan quality instruction. Our team is excited to put these tactical methods into action and see how our DAP plays out for the target group of students.


​Sources

Venables,D.R.(2014). How teachers can turn data into action. Alexandria, VA. ASCD. ​
0 Comments

    Author

    Mr. David Dulberger is currently a 5th grade magnet teacher at Emma K. Doub, a 1:1 Apple Distinguished School in Hagerstown, MD. He attended Salisbury University where he majored in Elementary Education and minored in Psychology. Dulberger completed part of his student teaching internship in Auckland, New Zealand where he taught 5th grade as well. Dulberger is part of the 2015 class of Apple Distinguished Educators, a 2014 PBS Digital Innovator, a Front Row Ambassador, and a SMART Technologies Exemplary Educator. Dulberger has presented at a variety of educational technology conferences and events such as SXSWEdu and FETC. He continues to deliver professional development for teachers around the world who share his passion for instructional technology. Follow him on Twitter @mrdulberger #5thGradeU

    Archives

    March 2018
    February 2018
    November 2017
    June 2017
    October 2016
    September 2016
    April 2016
    March 2016
    February 2016
    November 2015
    June 2015
    March 2015
    December 2014
    October 2014
    September 2014

    Categories

    All

Powered by Create your own unique website with customizable templates.